close
Google Timeline Maps
Using Processing + Unfolding to visualize Google Timeline data
bubble_chart Data VisualizationAfter having Google Timeline tracking enabled on my phone on and off over the last seven or so years, I became curious if the data was available for export and what it might show. After finding a way to download it, I slammed together a quick and dirty tool for mapping it with Processing and the Unfolding maps library. The early results were cool enough for a few friends to ask me to share the tool with them, so I shoe-horned everything into a work-in-progress GUI from a previous project and called the janky result “good enough for now”. Below are a few different views of my own data, followed by documentation for the tool. The documentation, along with the source code, can be found here if you’d like to play with your own data.
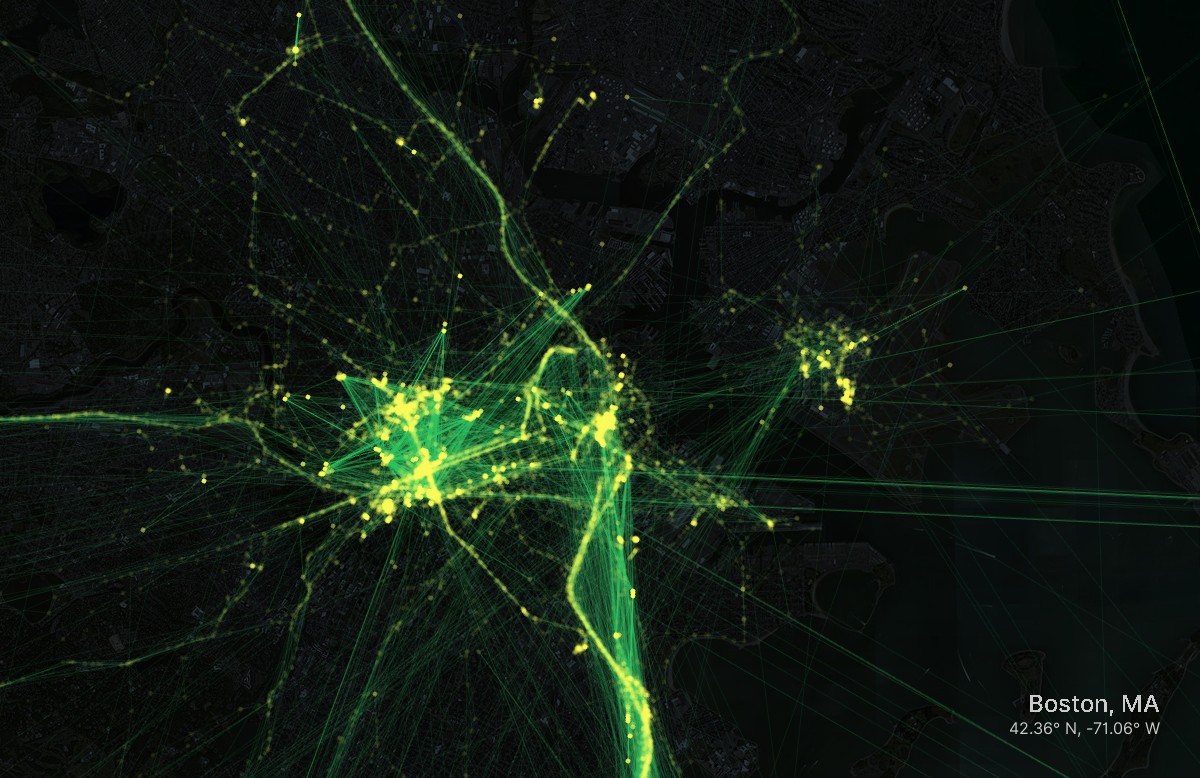
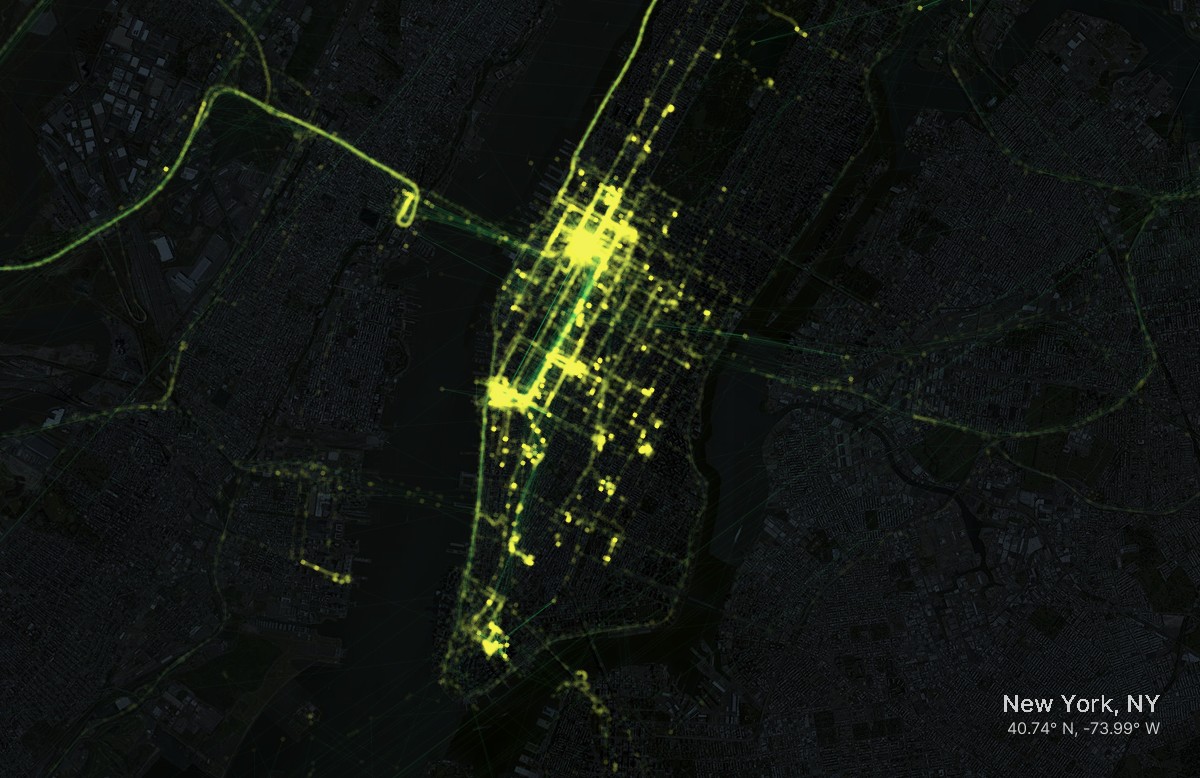
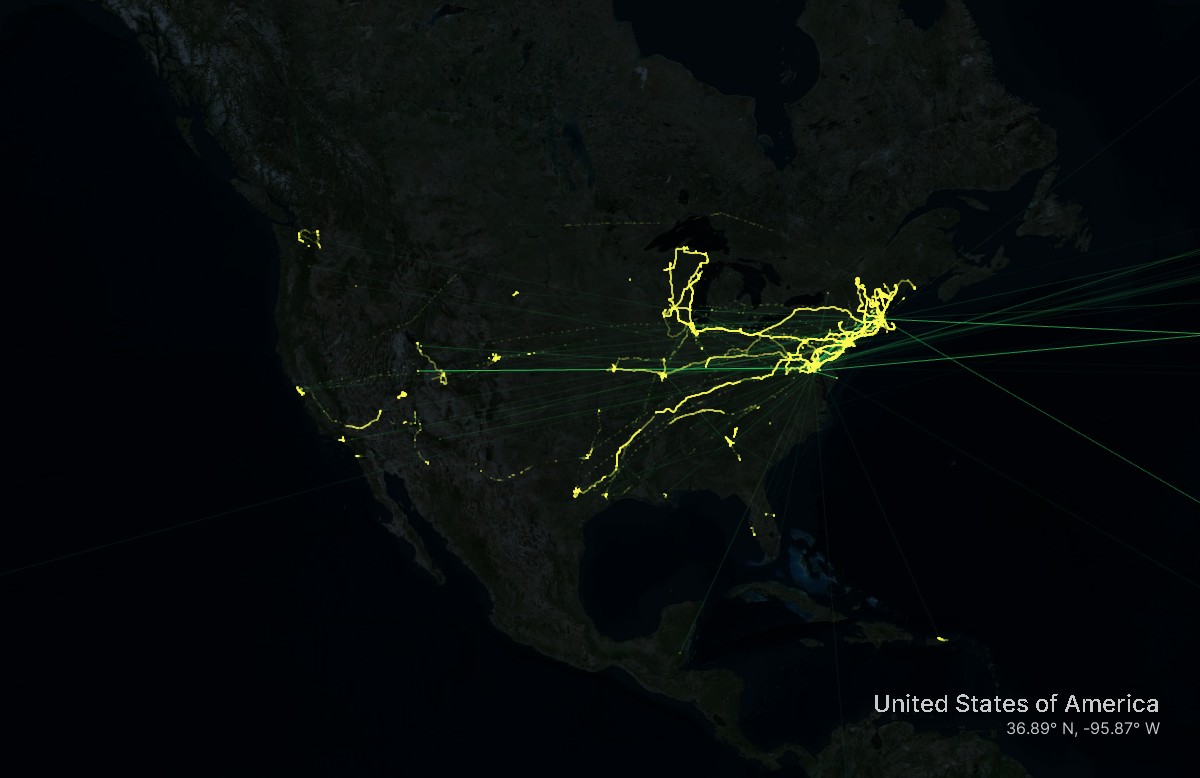
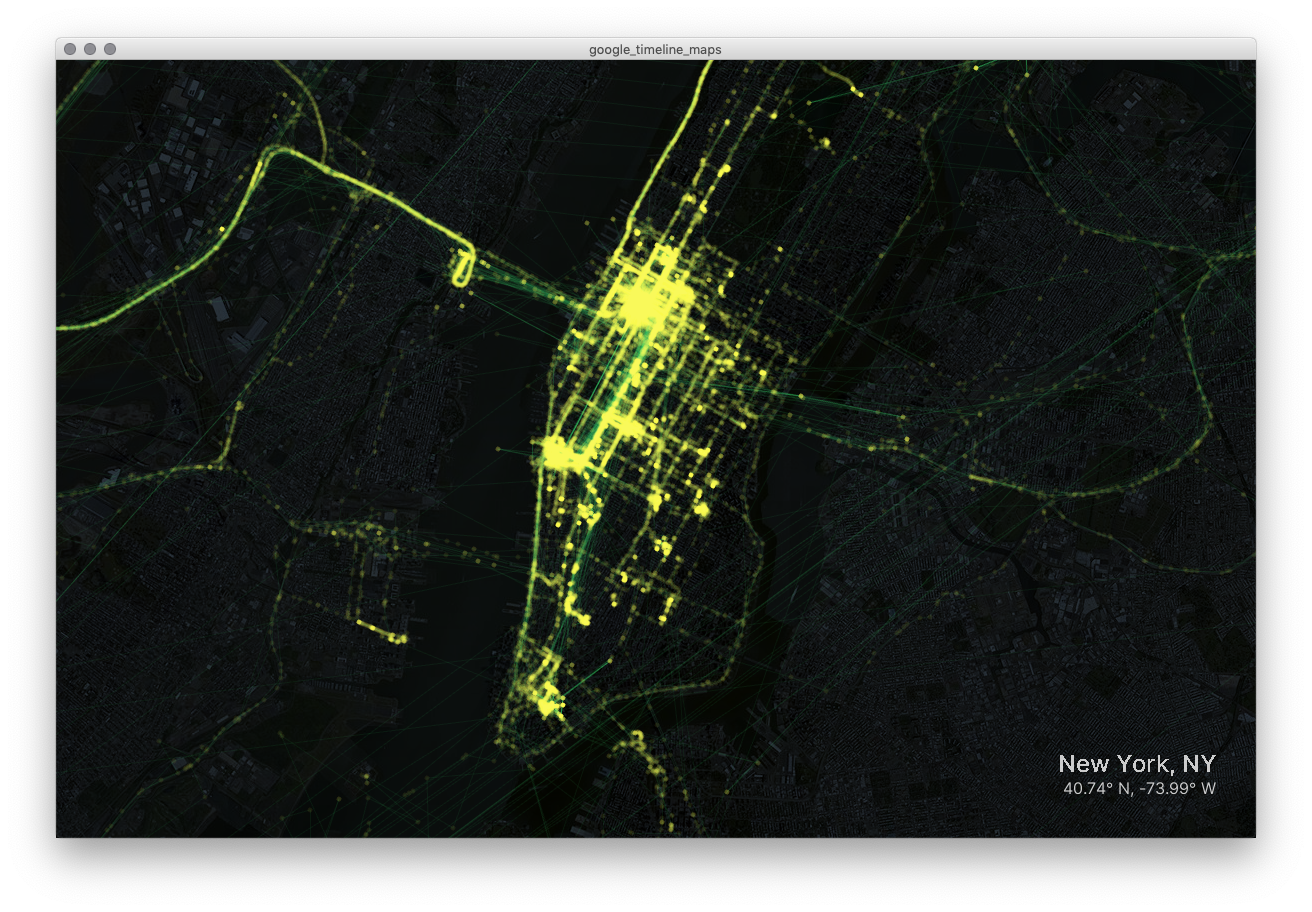
google_timeline_maps
Mapping Google Timeline data with Processing 2 & the Unfolding library
While this started out as a very hacky personal project to map my own data, once I shared some of my visualizations I started getting requests from friends wanting to make their own. While it’s still hacky, this is a rough first pass at streamlining my workflow for more general use. I’ve listed a few ideas for future development at the bottom of this page. Feel free to use https://github.com/bdharva/google_timeline_maps/issues to suggest additional updates and flag any bugs you encounter.
Application Setup
Note: These directions are for Mac OS X users. If you’re using Windows or Linux, you’ll be following a similar process, but will need to reference OS-specific directions at each of the websites indicated below and for Terminal-based steps.
Install Processing 2
To utilize the Unfolding maps library, you’ll need to be running Processing 2 (not 3). If you don’t already have it installed, go to https://processing.org/download/ and scroll down to “Stable Releases”. Click the OS-appropriate download link for version 2.2.1. Unzip the archive and move the extracted “Processing” application to your “Applications” folder.
Install Unfolding library
Go to http://unfoldingmaps.org/ and click the “For Processing 2” button under “Download”. Unzip the archive and put the extracted “Unfolding” folder into the libraries folder of your Processing directory. By default, the Processing directory will be at User/Documents/Processing. If this is your first library, you’ll need to create a libraries directory within it.
Install Python
If you don’t already have Python installed on your machine (you can check with python -V in Terminal), follow the documentation here to select and install the correct version. The parts of this process that utilize Python should work just fine whether you’re running version 2.x or 3.x.
Clone project repository
In Terminal, navigate to your Processing directory and execute git clone https://github.com/bdharva/google_timeline_maps.git to create a local clone of the repository.
Preparing Data
Download Google Timeline data
Access your Google Takeout at https://takeout.google.com/settings/takeout. De-select everything except “Location History”. Be sure that the “JSON format” option is selected. Follow the remaining steps to create and download your archive. Once downloaded, unzip the archive and move the extracted Location History.json file to the sketch directory .../google_timeline_maps/data/google.
Filter and transform data
In Terminal, navigate to the same directory where you’ve just saved your location history file. If you want to map the full unfiltered dataset, simply execute python parse.py. If you’d like to filter the data to a given date range, execute python parse.py [start_date] [end_date], with the dates formatted as YYYY-MM-DD. The Python script is just converting the .json file to .csv, re-formatting coordinates, and stripping away extraneous data not necessary for mapping.
Mapping Your Data
Launch the sketch
Open the google_timeline_maps.pde sketch in Processing 2 and launch the sketch with cmd + r or by pressing the play icon in the user interface. Depending on the size of the timeline dataset you’re loading, it might take a little while for the interface to load once you run the sketch.
Theory of operation
When the sketch finishes launching, you’ll start out on the “views” interface. Views can be defined with latitude and longitude, zoom level, the title you’d like to display on exports, and the preferred file name for those exports. The guides at the bottom of the page will help you to configure some views and change interfaces.
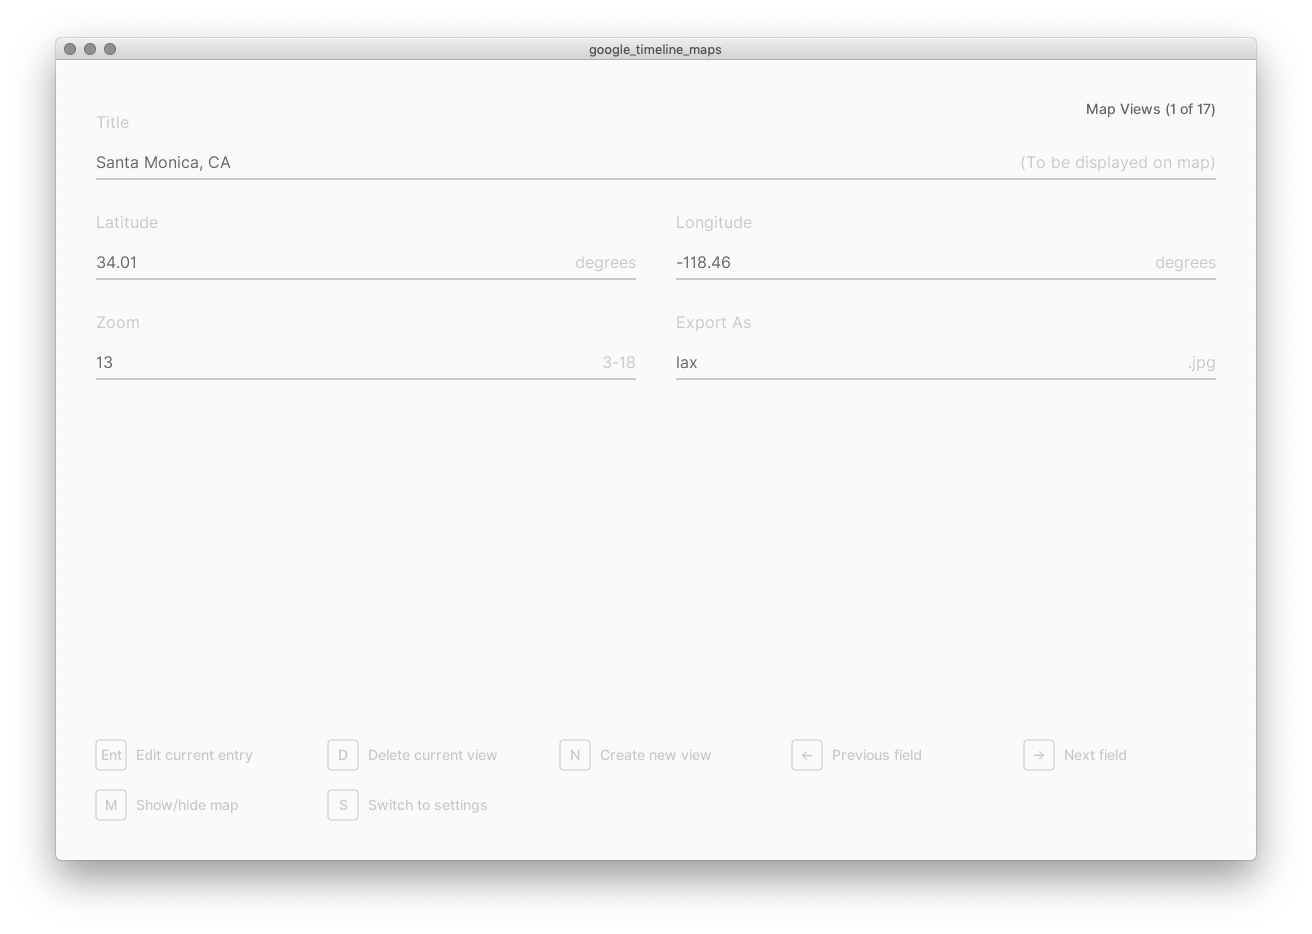
Short of developing a longer list of presets or a more robust inerface (not working on either at the moment), I recommend that you start by Googling city coordinates and then fiddling around in the map/plot view to fine tune things – more on that in a second.
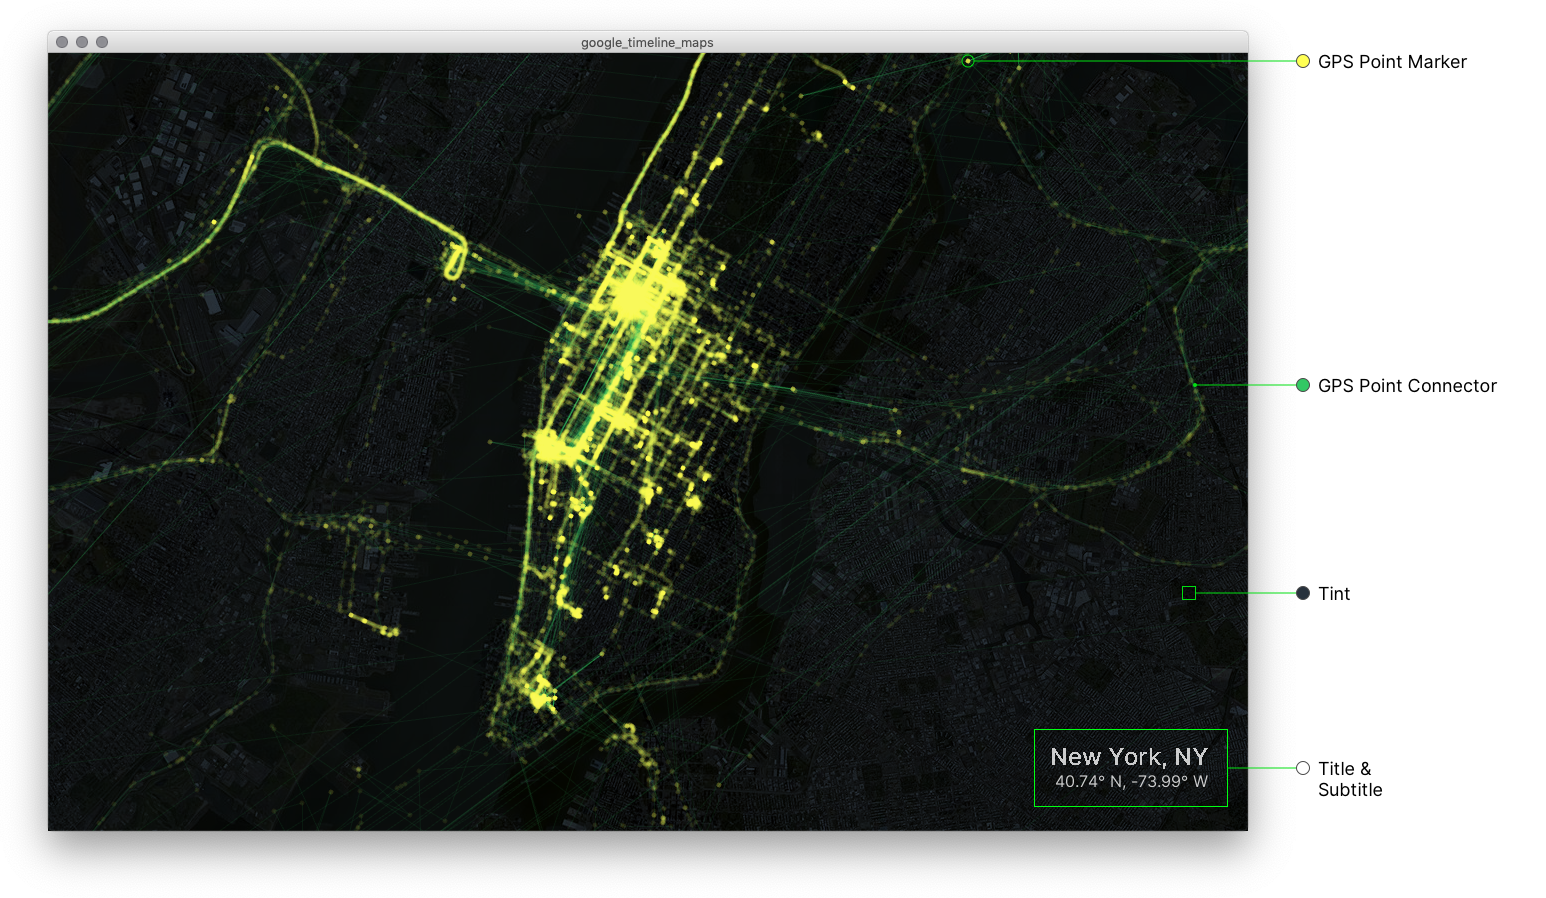
Pressing S will switch into the settings menu, where you can configure how you’d like your views to be rendered when mapping and plotting data. The annotated screenshot below lays out how these settings correspond with the output.
From the views interface, you can toggle to a map of the view with M. Here you can pan and zoom to get the view right, and the underlying settings for the view will be automatically updated and saved. Pressing P will toggle on and off a plotted view of the data overlaid on the map.
Every time you plot the data, the view will be saved under the specified file name. Note that if the guides are displayed while plotting, they will be included in the export. I tend to leave them on while fine-tuning the view, and then hide them when I’m ready to plot my final export. It’s also worth noting that, for now, the map cannot be panned or zoomed while data is plotted.
Exports will be saved in /exports nested within the directory that you’re running the sketch from. All files will be prefixed with the date, so multiple plots of a given view on a given day will overwrite one another unless you change the specified file name for the view.
Development Notes
Known Bugs
- None at the moment
Known “Papercuts”
- Lack of proper data validation on form inputs; lack of error handling for errors that this can introduce
- Can’t show/hide guides while plotting data; have to un-plot, hide guides, and re-plot to export clean graphic
- Can’t pan/zoom map while data is plotted
- New views are created in a bullshit random order
- Map guide text/icons collide when user-specified export size is too small
Future Development
- Enable users to constrain date range of plotted data directly within program
- Remove need for Python transforms; load Google JSON straight into program
- Provide as standalone application once all data wrangling is handled in-app
- Provide previews of style customizations in settings menu
- Enable users to specify alternate map tile providers